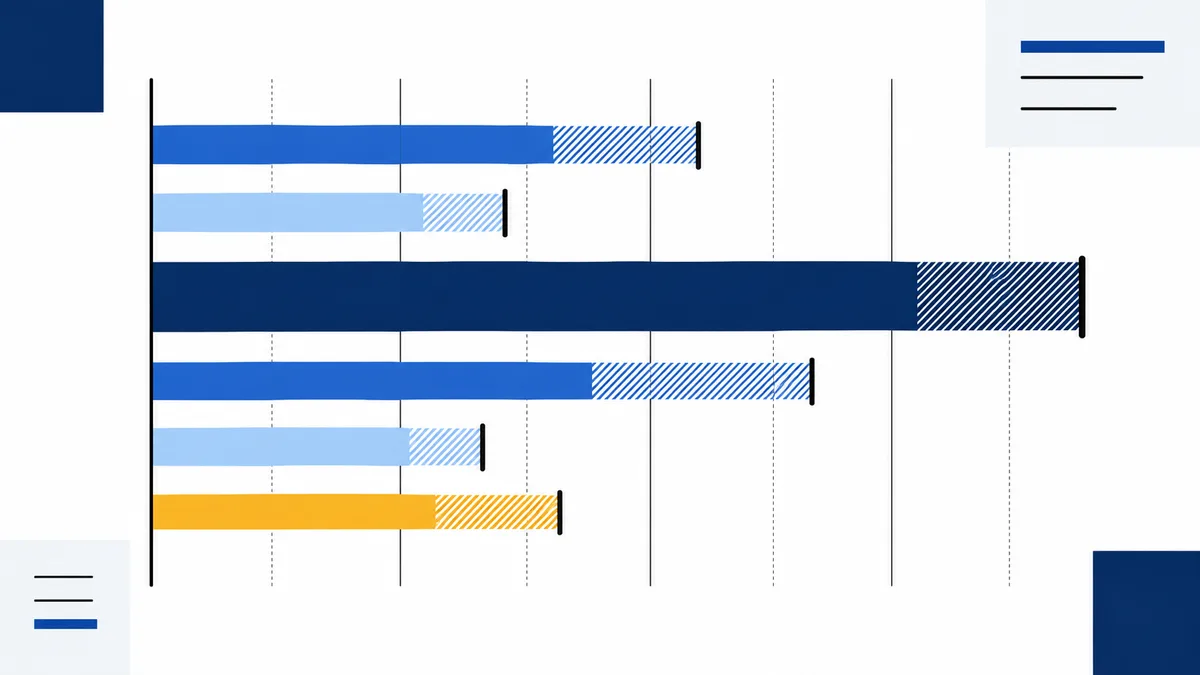
An overall MSCEIT score and a comparison between two branch scores are different claims. A useful total can coexist with uncertainty about which branch is higher for one person. Branch reliability or factor-structure findings alone do not settle that comparison; look for version-specific evidence about precision for the paired difference. Without it, treat the displayed ordering as tentative.
A total and a branch gap answer different questions
An overall ability-EI score can remain useful when evidence supports interpreting the total, even if the report does not establish that one branch is reliably higher than another. The broad score summarizes performance across the test’s emotion-reasoning tasks. A claim such as “my strongest ability is perceiving emotion” is narrower: it depends on whether the observed gap between that branch and another is precise enough to support their ordering. A displayed difference alone does not answer that question. Keep those conclusions at their proper scale. MSCEIT 2’s initial research reports good reliability for its overall score and acceptable reliability for three of its four subscales, while Connecting was weaker; those findings support considering the broad score under the revised test’s own evidence, but do not certify an individual branch ranking. The original MSCEIT V2.0 is a different version with its own evidence. Findings about it cannot simply be transferred to MSCEIT 2, or vice versa. Until documentation addresses the relevant branch contrast, read the total at the level its evidence supports and treat the larger branch as a lead for reflection, not a settled personal strength.
Sources: Measuring emotional intelligence with the MSCEIT 2: theory, rationale, and initial findings
What exactly is being compared in an ability-EI report?
An ability-EI report starts with performance on tasks designed to sample emotion reasoning: for example, judging what an emotion may communicate or how it might change as a situation develops. That is a test performance under specified item and scoring conditions. It is not a transcript of how someone usually handles a tense handoff, nor a direct observation of their conduct in every meeting. The distinction matters because readers often move from a task result to a claim about everyday behavior without noticing that they have changed the subject.
There are three claims to keep apart. A total summarizes performance across a wider set of tasks. A branch score summarizes performance within one domain of the test’s model. A difference, A minus B, says how far apart two branch estimates appear and which is numerically larger. The first two describe levels on the report; the third compares them. It is possible for the report to show A above B as a matter of arithmetic while the evidence remains insufficient to say that A is stably higher than B for this person. The observed order is real on that report; confidence in the order is a further interpretation.
Reliability enters at this point in a practical way. For the report in front of the reader, it concerns how consistently and precisely the relevant score can be estimated under the test’s measurement model. A strong reliability result for the total addresses the broad summary. It does not, by itself, tell the reader how much uncertainty surrounds the gap between two branches. Likewise, a branch estimate can be useful as an estimate of performance in that task family without supporting a confident comparison against every other branch. The precision needed depends on the claim being made: describing one branch and ranking two branches are not the same job.
The same three levels also prevent a common reporting shortcut. A branch can be above another in the printed profile without being a reliable personal hierarchy; that is not a contradiction. The report can state the ordering of its calculated scores exactly. The extra claim—that the order would remain if the person's underlying performance were measured with comparable tasks again—concerns how much noise or instability could change that order. A total can be estimated with useful precision while a small internal gap remains difficult to distinguish, because combining many task responses and comparing two components ask different questions of the data. No conclusion about one person's difference follows merely from the fact that the branches belong to the same theory.
This distinction also keeps the word “strength” from doing two jobs at once. In everyday speech it may mean a skill someone regularly shows and others can observe. In an ability report it can mean a comparatively high score on one category of test tasks. Those meanings may overlap, but the score alone does not show that they do. Someone who wants to understand a recurring work interaction can use a branch result to choose what to pay attention to, then examine the interaction itself; the result should not be presented as a record of that behavior.
The branches are intended as related parts of a broader ability, which helps explain why a total can carry meaning even when a finer ordering is unsettled. Their relationship does not make the pairwise question disappear. A broad score pools information across tasks; a contrast asks whether the difference between two estimates is distinguishable from the uncertainty in both and in how their errors relate. Knowing that each estimate has some consistency is not yet knowing that their separation is precise.
Consider an explicitly illustrative workplace case: a person receives a higher result on one emotion-task family and a lower result on another, then wonders whether the first is a dependable strength in difficult conversations. The score pattern can suggest something to notice when those conversations happen. It cannot establish what a colleague experienced, because the test sampled answers to tasks rather than observing that exchange. The report’s branch order is a description of its scores; the claim about conduct, and the claim that one branch truly exceeds another, each require evidence suited to that particular inference.
Why did the original four-branch picture remain contested?
The original MSCEIT V2.0’s four-branch account has support in its development report, but later analyses do not make the branch structure an uncontested result. The development and standardization paper, “Measuring emotional intelligence with the MSCEIT V2.0,” describes 21 emotion experts and a general standardization sample of 2,112. Its abstract says the authors examined agreement among expert answers, reliability, and factor structure, and reports reasonable reliability and support for the theoretical models. That is meaningful evidence that the test’s scoring and proposed organization were examined in its original development. It is not, by itself, an independent confirmation that four distinct branch scores will emerge under every analysis, or a precision estimate for a particular person’s gap between branches.
The distinction matters because a development study can test whether the intended model is plausible while an independent analysis asks whether the observed score relationships fit it as cleanly as the model suggests. The report’s abstract-level conclusion supports the theoretical organization; it does not provide enough detail to settle all later disputes about branch distinctness. In particular, support for a model at the sample level describes how scores are organized across people in the study. The question of whether the same person’s two branch estimates are separated reliably concerns the uncertainty of that individual contrast. One finding can bear on the structure without answering the other question.
An independent paper, “A psychometric evaluation of the Mayer–Salovey–Caruso Emotional Intelligence Test Version 2.0,” reports a more qualified pattern. Its accessible abstract describes good reliability for total, area, and branch scores, alongside comparatively low reliability for most subscales. It also reports only partial support for the proposed four-factor model: the preferred account included general emotional intelligence and three first-order branch factors. That result challenges a simple reading in which every branch is cleanly established as a separate component by the original evidence. The publisher’s full text was not available for this review, so the report here stays with the abstract; it does not supply unverified sample details, estimates, or explanations for the model difference.
The independent evaluation does not erase the original development finding. It puts a boundary around it: the intended four-branch structure received support in the development work, while an independent evaluation found that a different, more compressed structure fit its analyses better and that subscale reliability was comparatively low. Those are competing pieces of evidence about how finely the original test’s scores divide. Neither result establishes that the instrument is wholly valid or invalid. A structural model is an account of the pattern of relationships among scores; it is not a verdict on every interpretation or use of the test. The difference between four first-order branches and a general factor with three first-order branches is consequential because it changes how much specificity the score map appears to justify. A reader should therefore avoid treating the four labels as proof that each names an empirically independent capacity, while also avoiding the reverse shortcut of assuming that related branches must be interchangeable. The evidence supports examining how much separation the data sustain, rather than deciding by the number of labels printed in a report. Neither account alone settles whether another sample or scoring implementation would reproduce its preferred structure; replication under comparable conditions would help distinguish a stable pattern from a study-specific fit.
A meta-analysis adds another reason not to treat the four branches as fully independent. “The factor structure of the Mayer–Salovey–Caruso Emotional Intelligence Test V 2.0 (MSCEIT): A meta-analytic structural equation modeling approach” reports a very high association between the perceiving and facilitating branches (r = .90) and partial support for a higher-order general emotional-intelligence factor. In the studies combined, people who scored higher on perceiving tended also to score higher on facilitating. A strong association is compatible with related branches contributing to a broader ability; it makes a claim that the two domains behave as sharply separate capacities harder to assume. The abstract reports only partial higher-order support, so it also does not warrant collapsing every branch into a single undifferentiated score.
These sources address related but non-identical questions. The development paper asks whether the proposed scoring model has support in the instrument’s original work. The independent evaluation tests whether the four-factor arrangement holds up in its own analysis and reports partial fit. The meta-analysis estimates relationships across studies and finds a notably close perceiving–facilitating link alongside partial support for a general factor. Differences in study, sample, and analytic model can produce a mixed record without any one result simply cancelling the others. Since the independent evaluation’s full text was not confirmed, the available material cannot establish which methodological detail explains the difference; that uncertainty should remain visible rather than being filled with a guessed account. Nor does an average pattern across a study identify the pattern for every respondent. A branch relationship can be strong across a sample while individuals still differ in their relative scores; sample-level structure describes the measurement map, not each person's location on it.
Factor evidence still does not tell an individual how much a pair of branch scores might shift on another comparable measurement. A four-factor result concerns whether score patterns across a sample can be represented by four branches. A strong correlation concerns how scores tend to move together across people. Neither supplies the joint uncertainty around one person’s A-minus-B contrast. Even if two branches are distinguishable in a model, an individual gap could be small relative to its measurement uncertainty; conversely, related branches may still differ for a particular report. The original-version literature therefore supports a cautious conclusion about structure: the four-branch interpretation is theoretically grounded and has empirical support, but its separateness is contested across analyses. It leaves individual contrast precision as a separate evidentiary question.
Sources: Measuring emotional intelligence with the MSCEIT V2.0; A psychometric evaluation of the Mayer–Salovey–Caruso Emotional Intelligence Test Version 2.0; The factor structure of the Mayer–Salovey–Caruso Emotional Intelligence Test V 2.0 (MSCEIT): A meta-analytic structural equation modeling approach
What does the Spanish evaluation add, and where does it stop?
The Spanish-language evaluation strengthens the case that a four-branch interpretation can be supported in a studied version of the MSCEIT V2.0. “The factor structure and psychometric properties of the Spanish version of the Mayer-Salovey-Caruso Emotional Intelligence Test” reports a three-study program. Its abstract describes internal-consistency analyses, a retest after 12 weeks, tests of the proposed hierarchical structure, gender-invariance analyses, and a third study of prospective psychological well-being. The work therefore examines more than a one-time factor fit: it asks whether scores show consistency over time and whether the proposed organization can be represented in the Spanish version and the studied groups.
The authors report internal-consistency and 12-week test–retest evidence, and confirmatory analyses supporting a three-level hierarchy with four first-level branches. The structure places four branches at the most specific level while retaining broader organization above them. This is a direct counterweight to reading the original-version evidence as a simple rejection of four branches: in this Spanish evaluation, the hierarchical model received support. The retest component also adds temporal evidence that the scores showed consistency across the two measurement occasions under the study conditions. Neither result should be expanded beyond what the abstract says; it provides no branch-specific coefficient or estimate of the uncertainty surrounding an individual difference between two branches.
The evaluation also reports cross-gender invariance analyses. In measurement terms, these analyses examine whether the score structure operates comparably across the gender groups included in the study. That supports a more specific interpretation of the studied Spanish version than a factor model tested in one undifferentiated sample alone. It does not mean that every relevant form of equivalence has been established, and the abstract does not give a basis for extending the finding to all languages, populations, or administration settings. The evidence is useful within its described scope: it adds a cross-group structural check, rather than a general certificate that the same interpretation transfers unchanged wherever the MSCEIT is used.
For the third study, the abstract says the Spanish MSCEIT scores incrementally predicted prospective psychological well-being beyond personality traits. This is a criterion-related finding: in that study, the scores contributed to prediction of a later well-being measure after the personality variables were considered. It gives the instrument’s scores a potential relationship to an outcome beyond their internal organization. It does not show that a particular branch causes well-being, that the prediction will be equally useful in a workplace, or that the highest branch in one person’s report identifies the behavior that person should change. Those would be different claims from the prospective association reported.
Together, the Spanish findings add several kinds of evidence at the level the study examined: consistency within administrations, retest evidence over 12 weeks, support for a hierarchical structure with four first-level branches, gender-invariance analyses, and prospective prediction of well-being beyond personality traits. That combination makes the Spanish work a substantive counterpoint to the independent evaluation’s partial support for the original four-factor model. The studies need not be forced into one verdict: version and language differ, as do their samples and analyses. The Spanish results show that four branches can be supported in a particular translated version and studied population; they do not settle every structural question about the original English-language evidence.
Most importantly for a reader comparing two branch scores, the abstract does not report an uncertainty interval for an individual A-minus-B difference. Internal consistency and retest findings concern consistency of scores under the reported study design. Structural analyses concern how scores organize across participants. Gender-invariance analyses concern comparability of that organization across the studied groups, and prospective prediction concerns association with a later outcome. These findings can strengthen confidence in the studied version for those purposes without revealing whether a visible gap between two branch estimates for one person is larger than the uncertainty in that gap. The Spanish evaluation adds credible support for a four-branch account at its studied level; a direct, applicable contrast estimate remains a distinct piece of evidence.
What changed in MSCEIT 2?
MSCEIT 2 has its own initial evidence, so conclusions about its scores need to start with the revised instrument rather than inherit the original MSCEIT V2.0 debate. In “Measuring emotional intelligence with the MSCEIT 2: theory, rationale, and initial findings,” the authors report a five-study program: an item-set viability study with 43 participants, expert scoring-key work involving 8 experts, pilot testing with 523 participants, a normative study with 3,000, and a study relating the old and revised tests with 221. These stages serve different purposes: developing and checking the revised material, examining its scoring, describing results in a larger normative sample, and relating the versions. The five samples are not one pooled validation cohort, and their combined count should not be presented as a single study sample. The sample sizes clarify what the paper means by an initial program: the small early stages address item and scoring development, the 523-person pilot precedes the larger normative sample, and the 221-person comparison relates results from two versions. These roles should not be collapsed into a claim that each finding was independently demonstrated in all 3,000 normative participants. The reported sequence gives readers a map of the evidence base and its different tasks, not five replications of one result.
The revised paper presents four domains—Identifying, Using, Understanding, and Managing—as subscale scores within its account of emotional intelligence. Its authors report evidence supporting those four scores. That is a claim about how the revised test organizes its own results, based on this program; it does not retroactively decide whether the original MSCEIT V2.0’s four-branch model fit the earlier data. The revision’s rationale and its findings belong to MSCEIT 2, with its own item set, scoring and studies. Even a supported four-domain structure at the scale level describes patterns in study data. It does not estimate whether a particular respondent’s Identifying score is reliably higher than their Managing score. The authors’ theoretical rationale is relevant insofar as it explains why the revised score report includes those four domains: the domain labels are intended as parts of a broader model, not unrelated standalone traits. That rationale can make the score organization intelligible, but theoretical coherence and empirical score evidence remain separate. The study's reported support for four subscale scores is the empirical contribution; it still says nothing by itself about how stable a small difference between two of those scores would be for one person. This is why the revision needs to be described in its own terms instead of as a repair that settles the earlier literature: the relevant question is what the revised item set and scoring support, not whether the old controversy can be relabeled resolved.
Reliability results also differ by level. The article reports good reliability for the overall score and acceptable reliability for three of the four subscales; Connecting is the weaker subscale. That uneven pattern matters when reading a profile: broad-score evidence cannot simply be transferred to each domain, and the weaker subscale result deserves less confidence than the others on the evidence reported. The authors also report adequate precision across most ability levels, a separate result about where the revised test provides information. Neither the reliability pattern nor the information curve supplies a direct uncertainty estimate for each person’s paired domain difference. Those are distinct score questions. The distinction between an overall coefficient and subscale coefficients is consequential here. A total draws on a wider body of test information, whereas a subscale rests on a narrower slice; the paper's own pattern therefore gives no basis for assuming equal precision across all report lines. Connecting is singled out as comparatively weaker, not rendered meaningless, and the other three are described as acceptable rather than interchangeable with the overall score. The authors’ results warrant preserving these distinctions when summarizing what the revision showed. Nor should the overall result be used to smooth over the profile-level variation. An aggregate can be more dependable while one narrower domain remains less so; reporting both levels is informative only if the difference in evidentiary strength remains visible.
The authors’ affiliations are relevant context for weighing an initial study: several are developers of the instrument or affiliated with its publisher. That relationship does not erase the reported methods or findings, but independent replication would make the evidence base stronger. The article offers encouraging initial support for the revised instrument’s overall and domain scores, alongside a specific weaker result for Connecting. It should be read as evidence about MSCEIT 2 at the levels and in the samples studied, not as a resolution of every structural dispute over MSCEIT V2.0 or as proof that any displayed pairwise gap is dependable for an individual. The revised article is most useful when read at that level of specificity: it documents a substantial staged research program and reports favorable overall evidence with a visible qualification at Connecting. The affiliation is part of the context because developers can bring expertise in the instrument and also have a stake in its interpretation; neither observation determines the result. A reader should therefore neither discard the study on authorship alone nor describe its initial findings as independent confirmation. The article’s staged design and authorship are both reasons to read closely: methods and sample roles show what was actually examined, while independent work can test whether the pattern persists beyond the development program. The immediate interpretive judgment is therefore favorable but bounded, with the specific Connecting weakness kept in view.
Sources: Measuring emotional intelligence with the MSCEIT 2: theory, rationale, and initial findings
Why can one reliability coefficient miss score-location differences?
A test can estimate ability more precisely in one part of its score range than another. This is conditional precision: the amount of information available depends on where a respondent is estimated to fall. A single reliability coefficient compresses performance across a distribution into one summary, so it can look reassuring while obscuring that estimates near some score levels carry more uncertainty than estimates near others. This matters when interpreting any score: the precision relevant to a person depends partly on the score region, not just on a test-wide average. For example, an estimate near a region with dense information can be more precise than one near a sparse region even when both come from the same instrument. The single coefficient does not show that distinction because it summarizes performance rather than locating the reader’s estimate on the curve.
“What Is the Ability Emotional Intelligence Test (MSCEIT) Good for? An Evaluation Using Item Response Theory” examined the original MSCEIT V2.0 in a French-speaking Belgian sample using item-response methods. The study found that test information was uneven: it was more concentrated toward lower ability levels and lower for respondents around average-to-high ability. In practical terms, the original version gave less information in those higher regions, so a single overall reliability summary could conceal where its estimates were less precise. This is a result for that version, analysis and sample; it does not describe the revised MSCEIT 2 or provide a confidence interval for an individual's branch gap. Item-response analysis makes that variation visible by asking how strongly the items distinguish among ability levels across the scale. In this study, the concentration toward lower ability means that the test was more informative there than around average-to-high ability in the sampled population. It does not follow that every person in the higher region received a poor estimate; the group curve describes relative information, not a personal error bar or verdict. The result helps locate a limitation in the original version’s score coverage without answering whether its branches form distinct factors or whether two branch estimates differ reliably.
The MSCEIT 2 study reports a different, version-specific information result. In its normative study of 3,000 participants, “Measuring emotional intelligence with the MSCEIT 2: theory, rationale, and initial findings” presents a normative test-information curve and reports adequate precision over most ability levels. “Most” leaves regions where the evidence is less adequate; the curve’s value is precisely that it shows precision by estimated ability location instead of compressing it to one number. This result accompanies the revised test’s reliability findings, but it is not the original MSCEIT’s curve repeated under a new label. The two analyses concern different test versions and study bases, so their shapes cannot be combined into one continuous account of MSCEIT precision. Its larger normative sample serves a different evidentiary purpose from the original-version Belgian analysis, and the paper’s description of adequate information over most ability levels is not a claim of uniform precision everywhere. The revised study thus adds a way to inspect score-location precision within MSCEIT 2. It should not be used to repair the original test’s curve by inference, because a change in version may change the item and scoring behavior that generates information.
A test-information curve describes how much information a measure supplies across ability locations in the studied design. It helps explain why a mean coefficient can hide score-range variation, but it remains population-level evidence about score estimation. Knowing that two observed branch scores fall in regions with substantial information would still leave a further question: how precisely is their difference estimated, given the relationship between those scores and their errors? Conditional precision adds detail about each score’s location. It does not, by itself, convert two branch estimates into a precise person-specific contrast. The distinction also prevents a tempting but invalid shortcut: if each branch estimate is reasonably precise at its own location, the subtraction of those estimates is not automatically equally precise. A contrast depends on how their errors relate, a question the curve alone does not answer. The curves help interpret where score estimates may be stronger or weaker; evidence targeted to the paired difference is still needed to judge the ranking itself. In short, score location refines what a test-wide coefficient can say about an estimate, while the paired-score question requires information about the relation between estimates as well. Keeping these levels apart preserves the useful contribution of both studies without turning either curve into evidence it was not designed to provide.
Sources: Measuring emotional intelligence with the MSCEIT 2: theory, rationale, and initial findings; What Is the Ability Emotional Intelligence Test (MSCEIT) Good for? An Evaluation Using Item Response Theory
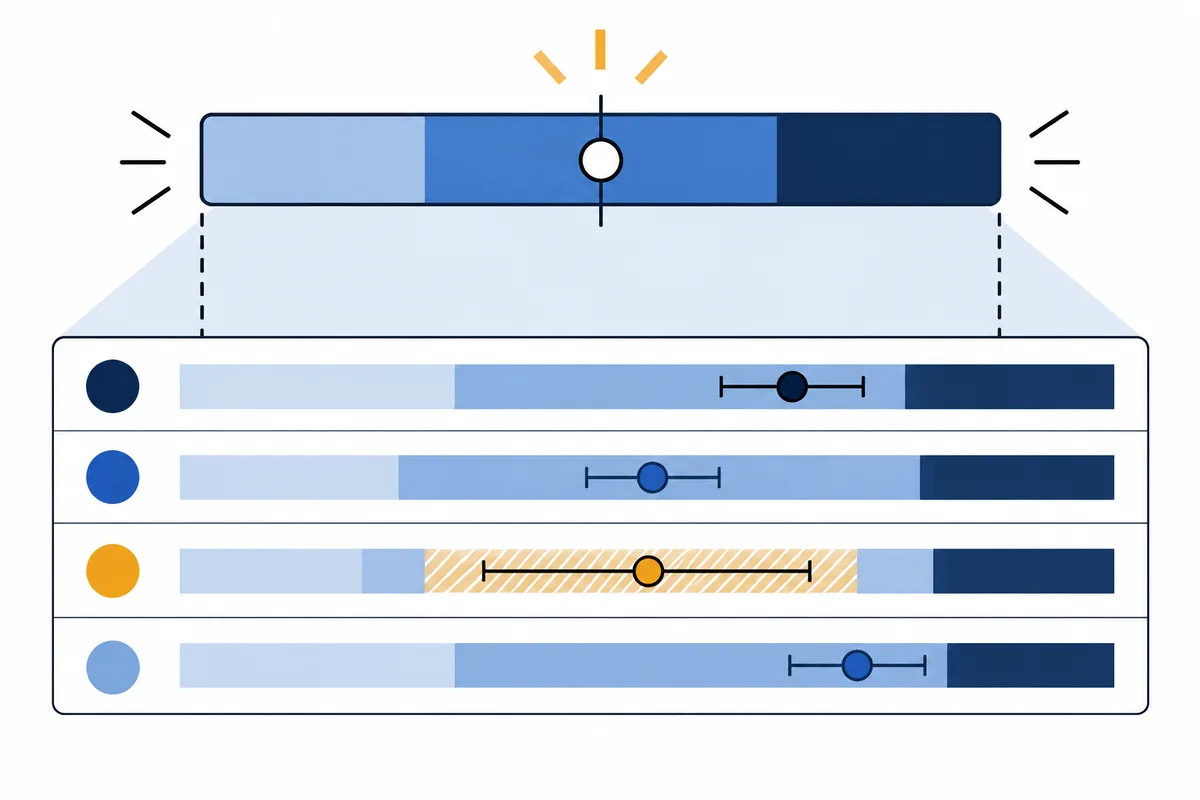
Why can two reliable branches still leave their gap uncertain?
Suppose a report gives a person two branch estimates, A and B, and the reader wants to know whether A is genuinely higher than B. The target is the difference, A−B. Reliability for A describes consistency or precision of A under a particular model and sample; reliability for B does the same for B. Neither marginal summary, on its own, describes how much error remains after one estimate is subtracted from the other. The uncertainty of a contrast depends on the two estimates together, including whether their errors tend to move in the same direction. This is a general statistical explanation of paired estimates, not a recalculation of MSCEIT results.
The algebra makes the missing ingredient visible. If each estimate equals its underlying score plus measurement error, then the error in A−B is the error in A minus the error in B. Its variance therefore includes the variance of each component and a joint term for how their errors covary. Because subtraction reverses the sign of the second error, positive covariance can reduce the variance of the difference: when both estimates are pushed upward or downward together, some of that shared movement cancels. If the errors are less strongly shared, or their relationship differs across the score range or measurement design, less cancels and the contrast can remain more uncertain. The marginal reliability of each branch does not tell the reader which pattern applies.
A simple hypothetical illustrates the point without assigning test values. Imagine two thermometers exposed to the same calibration shift. Each reading may be off from the true temperature, yet the difference between the readings can be stable because the shared shift affects both. Now imagine two readings with independent disturbances. Each reading can still have the same individual error variance as before, while their difference varies more because the errors do not cancel. This analogy demonstrates the mathematics only; it says nothing about the structure of any emotional-intelligence test. In a score report, the relevant question is whether the two branch estimates share error, and how much, under the scoring model used.
This joint term is why two individually respectable precision estimates do not automatically establish the ordering between their scores. A and B could each be measured with useful precision while their separation is small relative to uncertainty in the contrast. They could also carry substantial individual error that moves together, leaving their difference more stable than either level alone suggests. These are both mathematically possible. Which case applies cannot be inferred from the two reliability labels without information about the paired errors and the target scores. The observed fact that A exceeds B is therefore a description of the reported estimates; deciding whether the ordering is dependable requires evidence aimed at A−B.
Separate marginal confidence intervals do not solve the problem by themselves. Each interval describes uncertainty around one score under its own procedure. Subtracting their endpoints can create a range, but that range is not automatically a confidence interval with a known coverage rate for the difference. Its behavior depends on the joint sampling distribution, including covariance, and on the interval construction and model assumptions. Overlap or non-overlap between two separate intervals is likewise not a universal test of whether their difference is statistically distinguishable. Those visual comparisons may be useful for describing marginal uncertainty, but they answer a different question unless the method explicitly derives inference for the contrast.
A direct contrast estimate can be built in a suitable joint model or repeated-measure design if the design supplies the needed information and its assumptions are defensible. A paired model might estimate how the two components co-vary; repeated observations might help characterize how their difference changes across administrations. These are examples of possible routes, not a prescription for MSCEIT scoring. A method that assumes independent errors, for instance, would produce a different contrast uncertainty from one that estimates shared error, and either could mislead if its assumptions do not fit the instrument. The documentation must say what target and model were used before the result can be interpreted.
A further distinction helps keep this reasoning precise: correlation between observed branch scores is not itself the covariance between their measurement errors. Observed scores can co-vary because the underlying abilities are related, because the scoring design creates shared influences, because errors are shared, or through several mechanisms together. A high observed correlation therefore cannot simply be inserted as the missing joint-error term. The relevant covariance depends on the measurement model and on which uncertainty is being estimated. A model for group-level score relationships may describe the first pattern without quantifying how much a particular person’s difference would vary under repeated measurement. That is why the method must identify its score target and error assumptions rather than rely on a correlation label alone. This is statistical reasoning, not a reported MSCEIT result.
Accordingly, branch-level reliability is relevant background, but it is not a substitute for uncertainty around a branch contrast. Nor does the fact that both branches belong to a broader total reveal the joint error behavior of their difference. The mathematical point is narrower: subtraction creates a new score target whose precision depends on the relationship between the component errors. Without a method that estimates or otherwise justifies that relationship, two marginal branch summaries leave the person’s relative ranking unresolved.
What evidence would settle an individual branch comparison?
Before treating one branch as stronger for an individual, look for precision evidence aimed at the paired contrast in the exact score report being interpreted. The Standards for Educational and Psychological Testing (2014 Edition), jointly published by AERA, APA, and NCME, frame precision evidence around the interpretation and use of scores. Applied here, that principle means the relevant evidence should address the claim “this person’s A score is meaningfully higher than their B score,” rather than only reporting that the total or each branch has some reliability. The Standards give professional guidance for judging the fit between evidence and interpretation; they do not report an MSCEIT branch comparison or supply its estimate.
The documentation should first make clear which instrument form and language produced the scores, and how the reported branch scores were generated. A reader needs to know whether the evidence concerns the same version and scoring model as the report in hand. If the report uses a transformed or standardized scale, the score target matters as well: uncertainty for a raw component, a scaled score, and a difference between two transformed scores may not be interchangeable. This is not a demand for one named statistical formula. Different defensible methods can answer different questions, but the report should identify the question its method actually answers.
Most directly, the technical material should provide a joint contrast estimate or a defensible uncertainty interval for A−B, along with the procedure used to construct it. If it offers an interval, it should state the confidence level and the assumptions behind the interval, including how dependence between the two branch estimates was handled. If the method instead reports a probability, classification, or other summary, it should define that quantity and show how it relates to the individual comparison. A reader should be able to distinguish an estimated gap from evidence about how uncertain that gap is. Merely placing separate branch coefficients or confidence intervals beside each other does not provide this joint result.
Applicability matters as much as the method’s label. The documentation should describe the sample and conditions that support the contrast evidence: the version and language studied, relevant score locations or ability range, and any administration or scoring conditions that limit transfer. A method can be sound for one form or score region yet provide a poor guide to another. The Standards’ general principle is useful here because it asks whether the precision evidence matches the intended interpretation; it does not license a blanket claim that every report needs the same analysis or a particular cutoff. The necessary scope is the scope that lets a reader judge whether the reported contrast method fits this score pair.
A concise technical note could answer the key questions in prose: Which form and language were studied? What score difference is being estimated? How was uncertainty around that paired difference calculated, and what dependence assumptions does the calculation make? For which score locations and sample conditions is the evidence applicable? What does the resulting interval or estimate permit a reader to conclude? These questions focus the inquiry on the contrast without turning it into a demand for an exhaustive psychometric dossier. A technical manual may contain the answer even when a public product page gives only a high-level summary.
The estimate should also be reported on a scale that makes its meaning inspectable. If a procedure gives an interval for A−B, the interval should be centered on the estimated contrast and preserve the direction of subtraction, so the reader can tell whether zero remains compatible with the evidence under that procedure. A narrow interval around a positive difference and a wide interval spanning both directions have different implications, even if the point estimate is the same. This is a general reading principle, not a suggested cutoff: whether an interval supports a particular verbal conclusion depends on its stated target, coverage procedure, and intended interpretation. A report should not turn a point estimate alone into certainty about which branch is stronger.
Silence in a public summary should be read carefully. If a page reports overall or branch reliability but says nothing about a paired contrast, that page has not supplied evidence for the individual ranking. Its silence alone does not establish that the technical manual or research program lacks such an analysis. The reader can ask for the relevant documentation, then check whether it reports a contrast targeted to the same form, score definition, and applicable score range. Until that evidence is available, the defensible statement stays close to the observation: one displayed branch estimate is higher, while the documentation reviewed has not established how certain that individual ordering is.
The threshold is therefore methodological transparency plus fit: an identifiable method must target the person’s paired branch difference, disclose how it handles the joint behavior of the estimates, and show the population and score conditions to which its precision evidence applies. No single formula is required in advance, because the instrument’s design and model determine what can be estimated responsibly. What matters is that the reported evidence reaches the interpretation being made. The official standards page identifies the 2014 Standards as a joint AERA, APA, and NCME publication; the substantive guidance comes from the Standards themselves.
Sources: The Standards for Educational and Psychological Testing (2014 Edition); Standards for Educational and Psychological Testing: open access files
How can a tentative score pattern inform a workplace reflection?
A tentative branch pattern can suggest a question to watch for; it cannot tell you what happened in a particular exchange. Imagine, purely as an illustration, that a colleague challenges a proposal in a meeting and the report shows a lower estimate on a branch that seems relevant to handling emotion. The score may make you curious about how you respond when your view is questioned. It cannot establish that you became defensive, missed the colleague’s concern, or handled the disagreement poorly. Those are claims about conduct in that moment, and the meeting itself is the place to examine them.
Start with a recent interaction you can recall without turning the score into a verdict. What did the other person say or do? What emotion did you notice in yourself, if any, and when did you notice it? What did you say next? A useful observation stays close to actions: whether you asked what evidence changed the colleague’s view, summarized the objection before answering, or moved quickly to defend the proposal. These details make the reflection testable. “I am bad at understanding people” turns one uncertain signal into an identity; “I answered before I could restate the concern” identifies something you can check and potentially change. Write that observation before deciding what it says about you; the sequence keeps the event separate from the interpretation.
A colleague’s perspective can add information about the exchange, especially when you ask about one observable moment rather than request a broad judgment of your emotional intelligence. For example: “When you raised that concern, did I leave room for you to explain it?” The answer is evidence about how that person experienced that interaction. It may differ from your memory, and it does not settle what your test score means. The aim is to learn what each source can contribute: the report gives you a prompt; your recollection and another person’s specific feedback help you inspect the behavior. Keep a brief note in the language of the event—what was said, what you did, and what you would try next time. This makes later reflection less dependent on a broad impression of whether the conversation went well. If the exchange had a clear work outcome, record that too, without assuming one response caused it.
One meeting can be difficult to interpret because the exchange has a history: the proposal may be rushed, the objection unclear, or the participants may have different responsibilities. Note the immediate conditions alongside your response. That gives you a fairer comparison if you notice a similar moment later. You are not collecting a private score or trying to prove a pattern from a handful of conversations. You are asking whether a chosen behavior helped you understand the disagreement and respond in a way that kept the work moving. If the same response appears across different situations, it may be worth discussing as a development goal; if it appears only under a particular pressure, the next useful change may concern how that situation is structured.
Then choose a small experiment for a similar conversation. You might pause before replying, ask one clarifying question, and summarize the concern in your own words before making your case. Afterward, note what you tried and what changed in the exchange. Keep the experiment narrow enough that you can remember whether you did it; do not set yourself the vague task of becoming more empathetic. If the response helps, repeat it in another relevant interaction. If it feels forced or fails to address the real disagreement, adjust the behavior rather than treating the score as an instruction. A practical reflection is useful because it produces something observable to revisit, not because it proves a branch label correct.
The private 32-item Emotional Skills Profile at /assessment is a separate educational reflection tool. Its recent-behavior summaries and judgments on authored situations can help you examine habits and responses. They are not an ability score or MSCEIT comparison, and they do not provide validated norms or settle the precision of a branch difference. Use the profile if a structured reflection on your own emotional habits would help you choose what to notice next; use the workplace interaction and specific feedback to examine what actually occurred.
What should you do next with a branch score?
First identify the exact test version, language, scoring report, and technical documentation behind the branch scores. Look for evidence that addresses the contrast between those two scores, and read only as much into it as its method supports. If the documentation reports that paired comparison, use its stated conclusion and scope. If it does not, keep the displayed order descriptive: one estimate is higher on this report, while the evidence you have does not establish a dependable individual ranking. Check that any published analysis matches the version and language in your hands; a result for a different form may not answer your report’s question. A technical manual or support contact may clarify where the relevant analysis is documented. Do not substitute a general reliability figure or separate branch descriptions for evidence of the contrast itself. That keeps the score claim tied to what the report can show.
For a practical next step, pick one recent interaction where the distinction might matter. Notice a specific response—such as whether you paused to understand a challenge before replying—and, when appropriate, ask a colleague about that moment. Treat this as an inquiry into behavior, not a test of whether the branch score was right.
For a separate reflection on recent emotional habits and responses to authored situations, explore the private Emotional Skills Profile at /assessment.
Questions readers ask
Can an overall MSCEIT score be informative when branch scores are uncertain?
Yes. Evidence supporting a broad total does not by itself establish the precision of each branch or whether the difference between two branches is dependable for an individual.
Does the highest MSCEIT branch score show a personal strength?
It identifies the higher reported estimate. To interpret that ordering as a dependable individual difference, look for precision evidence that directly addresses the paired comparison.
Do reliable branch scores prove that the gap between them is reliable?
No. Uncertainty in a difference depends on the joint behavior of both estimates, including how their errors relate. Separate branch reliability figures do not provide that information by themselves.
Do findings about MSCEIT V2.0 apply to MSCEIT 2?
The versions have distinct evidence and should be considered separately. Findings about score structure or information for the original MSCEIT V2.0 do not automatically establish precision for MSCEIT 2 or for an individual's branch difference.
Sources
- Measuring emotional intelligence with the MSCEIT 2: theory, rationale, and initial findings
The developer-authored five-study research program reports item-set viability (N=43), expert scoring-key work (N=8), pilot testing (N=523), a normative study (N=3,000), and old/revised test relations (N=221). Authors report evidence for four subscale scores, good overall reliability, acceptable reliability for three of four subscales, and adequate precision across most ability levels; Connecting is the weaker subscale. It does not provide direct uncertainty estimates for every individual pairwise branch difference.
- What Is the Ability Emotional Intelligence Test (MSCEIT) Good for? An Evaluation Using Item Response Theory
An item-response analysis of original MSCEIT V2.0 in a French-speaking Belgian sample found uneven test information, more concentrated toward lower ability levels and lower for average-to-high ability respondents. This concerns group-level score information for the original version, not an individual branch-difference interval and not MSCEIT 2.
- The Standards for Educational and Psychological Testing (2014 Edition)
AERA, APA, and NCME professional standards say precision evidence should fit the intended score interpretation and use; conditional standard errors may add information at particular score levels, and expanded interpretations can require evidence for change scores. This is guidance, not an MSCEIT branch estimate or validated formula for its branch contrasts.
- Measuring emotional intelligence with the MSCEIT V2.0
The original MSCEIT V2.0 development and standardization report describes 21 emotion experts and a general standardization sample of 2,112, examining answer agreement, reliability, and factor structure; the abstract reports reasonable reliability and support for theoretical models. It does not establish the precision of a particular individual's branch difference.
- A psychometric evaluation of the Mayer–Salovey–Caruso Emotional Intelligence Test Version 2.0
An independent psychometric evaluation of MSCEIT V2.0 reports good reliability at total, area, and branch levels but comparatively low reliability for most subscales, and only partial support for the proposed four-factor model; its reported preferred model included general EI and three first-order branch factors. This challenges a simple claim that the original four-branch hierarchy is uniformly confirmed.
- The factor structure of the Mayer–Salovey–Caruso Emotional Intelligence Test V 2.0 (MSCEIT): A meta-analytic structural equation modeling approach
Meta-analytic structural equation analyses of MSCEIT V2.0 studies report a very high association between perceiving and facilitating branches (r=.90) and partial support for a higher-order general EI factor. The result bears on branch distinctness and a general factor; it does not quantify uncertainty in one person's branch-score difference.
- The factor structure and psychometric properties of the Spanish version of the Mayer-Salovey-Caruso Emotional Intelligence Test
A three-study evaluation of Spanish MSCEIT V2.0 reports internal-consistency and 12-week test-retest reliability evidence, confirmatory support for a three-level hierarchy with four first-level branches, and cross-gender invariance analyses. Study 3 reports incremental prediction of prospective psychological well-being beyond personality traits. These Spanish-version findings do not supply an interval for an individual's branch difference or automatically generalize to every translation and use.
- Standards for Educational and Psychological Testing: open access files
The official standards site identifies the Standards as a joint AERA, APA, and NCME publication and provides the 2014 English edition. Supports provenance and authorship only; substantive measurement guidance is cited to the standards PDF.
Apply it to the real situation
Turn an EQ reflection into one behavior to practice
From this guide: A branch result can raise a question about your emotional habits, while its score difference may remain uncertain.
The Emotional Skills Profile offers a private reflection on recent emotional behaviors and authored situations, with practical guidance for considering a development priority. It is a separate educational tool, not an ability test or a way to resolve MSCEIT branch-score uncertainty. Use it to examine one habit you want to understand more clearly, then decide what observable action to practice.