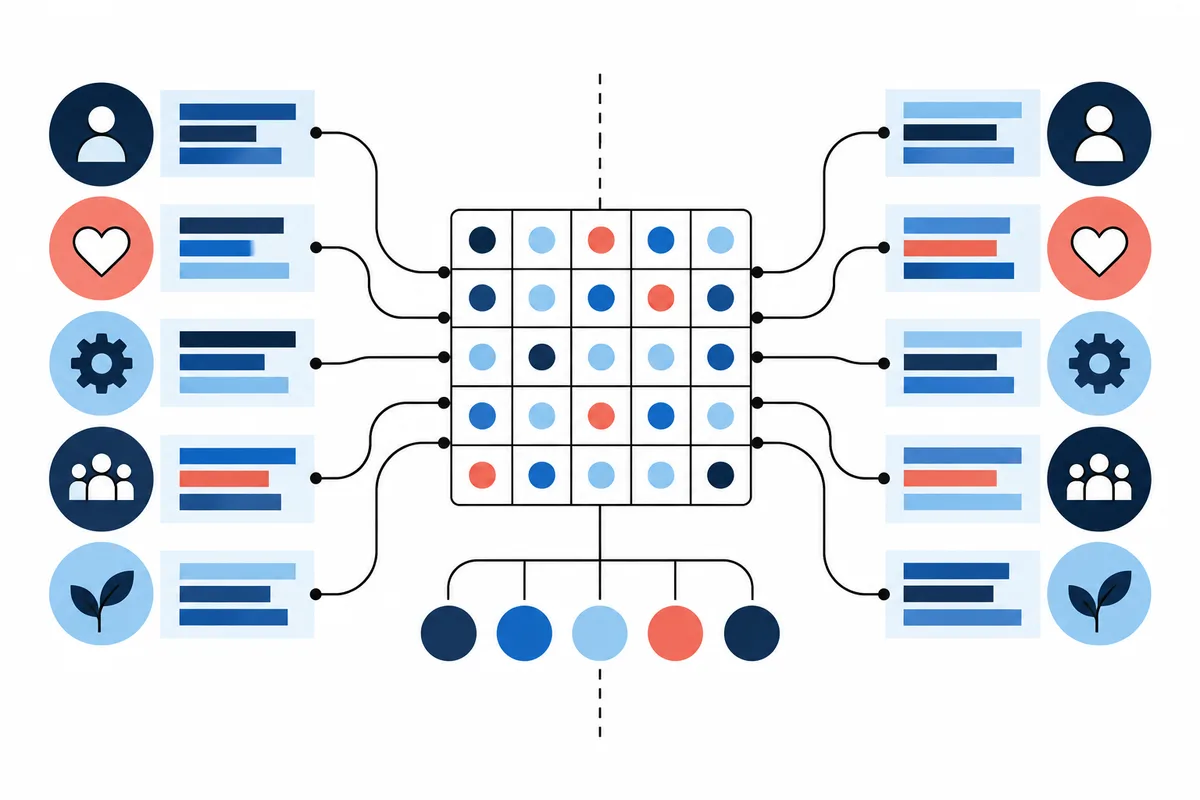
The 2021 Lebanon–UK study recovered a broadly similar four-factor pattern for 13 analyzed facets of the English 153-item TEIQue in two university samples, with strong alignment to the instrument’s original factor map. This supports structural resemblance in those samples; it does not establish equivalent scores, national differences in emotional intelligence, or results for other versions and languages.
What study and sample produced the comparison?
The comparison comes from “The Trait Emotional Intelligence Questionnaire in Lebanon and the UK: A comparison of the psychometric properties in each country,” which examined the full English TEIQue version 1.5. The instrument is a 153-item self-report questionnaire: respondents describe their typical emotional dispositions and behavior. The researchers analyzed responses from 342 Lebanese undergraduates and 187 UK undergraduates. Both groups completed the same English form, and the participants were recruited through university courses. Those details matter because the paper compares one instrument version across two student samples; it does not compare separate translations or a broad cross-section of either country.
The authors’ factor analysis asked how the questionnaire’s measured facets grouped together in each sample. A factor structure is that pattern of grouping: facets that vary together are represented under a broader factor. The researchers used exploratory factor analyses on 13 of the TEIQue’s 15 facets, extracting four broad factors in each group. Self-motivation and adaptability were left out of this factor analysis under the original model’s treatment, so the result describes the organization of the analyzed facets rather than a fresh test of every part of the questionnaire. The paper reports principal-axis extraction with Promax rotation, a method that allows the broad factors to correlate rather than forcing them to be independent. In practical terms, the exploratory procedure lets the observed responses suggest a grouping pattern instead of imposing an already fixed arrangement as the only possible answer. That makes it appropriate to the paper’s question about how the facets cluster in these data, while keeping the result tied to this specific analysis.
This setup gives the comparison a useful point of consistency: the same English questionnaire and a similar undergraduate setting were used on both sides. Using one form avoids a version change being the obvious explanation for different groupings, although it cannot by itself establish that respondents in both settings interpreted every item in precisely the same way. At the same time, recruitment through courses makes the samples convenient student groups, and the two omitted facets set a boundary around what was analyzed. The paper can therefore speak directly to whether the included facets formed a recognizable broad pattern in these respondents. A reader should keep that scope in view when interpreting the factor-map results that follow; the analysis is not itself a survey of national emotional intelligence or a complete audit of all 15 facets. Its value lies in identifying a shared broad pattern worth examining more closely, with the tested form and analyzed facets clearly specified for readers interpreting the result.
How strong is the four-factor resemblance?
The evidence is stronger than a matching count of four. In “The Trait Emotional Intelligence Questionnaire in Lebanon and the UK: A comparison of the psychometric properties in each country,” the extracted factors were compared with the original TEIQue factor map, and the reported correlations were high across all four broad domains. Well-being correlated .95 in Lebanon and .97 in the UK with its original-map counterpart; Self-control correlated .96 and .90; Emotionality, .96 and .98; and Sociability, .97 and .96. The pattern is consistent across domains: the factors recovered in each sample correspond closely to the intended broad organization, even though the correlation for UK Self-control is the lowest of the eight reported comparisons.
The authors also report Tucker congruence coefficients supporting similarity between the Lebanon and UK factor patterns. Congruence evaluates how closely two factor loading patterns align after accounting for factor orientation; it is useful here because exploratory analysis can produce factors in a different order or direction. Together, the correlations with the original map and the Tucker coefficients address more than whether each analysis happened to return four labels. They ask whether the recovered organization resembles the intended map and whether the two sample-specific patterns resemble one another. The reported alignment gives affirmative evidence on both structural questions.
That is a meaningful result for the paper’s narrow question. A factor count by itself can conceal very different groupings: one sample could produce four factors whose facets do not correspond to the same domains as the other sample. The close map correlations make that simple-count explanation less plausible for these results. The four labels refer to Well-being, Self-control, Emotionality, and Sociability, the broad organization the study set out to examine. The analysis therefore supports describing the full English TEIQue as showing a recognizable four-factor arrangement in both recruited samples, with substantial correspondence to the original map. A factor label alone can be broad enough to conceal a rearrangement in which different facets carry the meaning in each group. Here, the reported factor correlations address that concern by comparing each recovered domain with its counterpart in the original UK map; the Tucker congruence analysis provides a further comparison of the loading patterns. Their agreement is why the result carries more weight than the recurrence of four factors alone. It supports continuity in the questionnaire’s broad architecture across the two analyses, rather than merely a shared number of statistical groupings.
The explained-variance percentages are 56.27% in Lebanon and 60.31% in the UK. These figures summarize how much variation in the analyzed facet scores the extracted factors account for within each sample. They add a sense of the models’ coverage, but they are not another alignment statistic and should not be read as a comparative quality score. The central structural evidence is the closeness of the factor patterns, not the small difference between those percentages. A higher percentage in one sample does not mean that its respondents had more emotional intelligence or that its questionnaire worked better; it describes variance accounted for in that sample’s analyzed facets under this extraction. Keeping that distinction prevents a within-sample summary from being mistaken for a cross-group result.
Factor-pattern similarity has a specific reach. It shows that broad groupings among facets look alike in these analyses. The correlations and congruence coefficients do not compare item thresholds, response styles, or the distance represented by one score point. Two forms can preserve a similar broad map while particular items function differently, or while scores have different units. Thus the study’s high alignment is substantive evidence about broad organization, while the separate question of whether scores can be directly compared requires evidence aimed at that comparison.
Which facets resist a clean four-factor map?
A factor loading is the strength of the relationship between a measured facet and a broader factor in the analysis. A cross-loading occurs when that facet is associated with more than its keyed factor. In “The Trait Emotional Intelligence Questionnaire in Lebanon and the UK: A comparison of the psychometric properties in each country — accepted manuscript,” self-esteem shows this complication in both samples: its loading on Sociability exceeds its loading on its assigned Well-being factor. In Lebanon, the respective loadings are .49 and .37; in the UK, .52 and .27. The recurring direction matters more than treating either pair as a boundary between two kinds of person. The four broad labels still summarize the overall organization, while this facet sits statistically closer to a neighboring domain than its key alone would suggest.
The authors interpret the self-esteem pattern as reflecting overlap between the facet’s content and Sociability. That is a plausible account of why the association recurs, but the study does not isolate the cause. The same result could also depend on how particular items express self-esteem, or on features of these samples and the exploratory analysis. The loadings show a pattern among facet scores; they do not reveal why respondents answered as they did or demonstrate that self-esteem produces sociable behavior. Those explanations would require evidence designed to distinguish them, such as examination of item content alongside replication with other samples or measures. The important point is not that the facet must be reassigned: a cross-loading marks shared statistical association in this analysis, not a decision rule for changing the questionnaire’s scoring key. A stable assignment and a less exclusive empirical association can coexist. That distinction lets the recurring result qualify the map without making a stronger claim than the analysis supports. It also explains why a neat four-factor summary should be treated as a useful description of broad organization, not as proof that every component belongs exclusively to one domain. In this paper the self-esteem result is a repeated seam between domains, visible beneath an otherwise closely aligned map.
Impulse control supplies a separate, narrower qualification. In the UK sample it loaded .45 on Emotionality, above its keyed Self-control loading of .37. The manuscript does not report the same cross-loading pattern in Lebanon, so this result is not a shared feature of both factor solutions. It makes the UK facet map less tidy at this point without overturning the broader resemblance described earlier. The difference between the two cases matters: self-esteem’s stronger non-keyed association recurs across samples, whereas the impulse-control result is specific to the UK analysis. Neither finding is an observation of conduct in a meeting, a measure of how someone manages disagreement, or evidence of a cultural mechanism. They qualify how cleanly a particular facet belongs to one broad label; they do not convert the factor analysis into a record of workplace behavior. Nor does a loading tell a reader whether an individual who endorses certain self-esteem items will seek conversation, set a boundary, or respond calmly to criticism. Such behaviors require behavioral evidence at the level of people and situations. Here the warranted conclusion stays at the level of the questionnaire’s facet relationships: one recurring overlap and one sample-specific one coexist with the four-factor pattern.
Why can the broad map coexist with uneven facet consistency?
The manuscript reports Cronbach’s alpha of .56 for the Relationships facet in Lebanon and .71 in the UK. Alpha summarizes how consistently the items within a score covary in a particular sample. The difference therefore counsels more care when interpreting the Lebanese Relationships score as a narrow summary: its items were less internally consistent there. It says nothing about how capable Lebanese respondents were at forming relationships, and it does not test whether scores have equivalent meaning across the two groups.
The surrounding coefficients make this a mixed pattern, not a country ranking. In Lebanon, other facet coefficients below .70 included self-motivation at .61, empathy at .66, and adaptability at .64. At the broader factor level, however, Self-control alpha was .75 in Lebanon and .63 in the UK, while Emotionality was .67 in Lebanon and .80 in the UK. The direction thus changes with the score being summarized: Relationships is lower in Lebanon, but Self-control is lower in the UK. The paper also reports global-score alpha of .86 and .88, respectively. A broad total can have stronger item covariance while a narrower facet remains less consistent, because the total combines more content and items. That does not make the facet result disappear; it identifies where a reader should be cautious about fine-grained interpretation.
This coefficient answers a different question from the factor correlations and congruence discussed earlier. Those statistics compare the shape of broad loading patterns; alpha summarizes item covariance within each score and sample. Neither statistic substitutes for the other, and alpha is not a direct accuracy estimate or a test of measurement equivalence. The authors note that some lower facet coefficients have appeared in other samples, which gives context for the result without changing the reported .56. Alpha can also vary with the number and breadth of items in a score, so the coefficient should be read as a property of this item set in this sample rather than a permanent quality label attached to the facet. Taken together, the evidence supports a recognizable broad map alongside uneven precision at the facet level. The practical reading is specific: preserve the broad structural finding, and avoid treating the Lebanese Relationships facet as a finely measured individual difference on the strength of this coefficient alone. For a report user, that means a narrow facet result may be a prompt to inspect the underlying response pattern, but the study offers no basis for translating this sample coefficient into an estimate of one person’s score precision. A lower alpha is therefore a reason to narrow the claim made from that subscore, not a reason to rank the samples or discard the larger structural result.
What additional analysis would support a score comparison?
The Lebanon–UK paper’s exploratory factor analyses answer whether a recognizable broad arrangement appeared in each set of responses. A direct score comparison asks a more demanding question: do the scores represent the same construct on a sufficiently common scale in both groups? Similar factor patterns make that question reasonable to investigate; they do not answer it. The 2023 review “Measurement Invariance in the Social Sciences: Historical Development, Methodological Challenges, State of the Art, and Future Perspectives” describes a common multi-group confirmatory framework for testing the bridge. Its stages add constraints to a model, each addressing a different aspect of comparability.
At the configural level, researchers specify the same basic pattern of which items or indicators relate to which factors in each group. This asks whether the proposed structure has the same form. It is a useful starting check, but the review emphasizes that matching form alone does not establish that a score point has the same meaning or support a substantive group comparison. For the TEIQue, the study’s similar four-factor exploratory maps are evidence of resemblance; they are not themselves a confirmatory test that the same item-level pattern fits both groups under one specified model.
Metric constraints then test whether corresponding item loadings can be treated as equal. In plain terms, they ask whether changes in the underlying factor are reflected in item responses with comparable strength across groups. That matters when comparing relationships involving the factor, such as whether it relates similarly to another variable. Scalar constraints add equality of item intercepts, the expected item scores when the factor is held at a reference level. Those intercepts matter for latent-mean comparisons because unequal starting points can create score gaps even when the underlying factor level is alike. These levels are related but answer distinct questions; a result at one level does not automatically settle the next.
A follow-up study would therefore need the item-level responses to the same English full form, a specified multi-group measurement model, and an explicit target comparison. Is the aim to compare factor relationships, latent means, or observed totals? The population also needs definition: the original paper recruited undergraduates through university courses, so a replication of that question should identify comparable student populations rather than silently treating country as a representative sample. Researchers could then report which constraints fit, where departures occur, and how those departures affect the chosen estimate. The 2015 article “The Comparability of the Universalism Value over Time and Across Countries in the European Social Survey: Exact vs. Approximate Measurement Invariance” illustrates exact and approximate approaches on a different construct and dataset; it clarifies possible analytic choices, but says nothing about TEIQue performance.
There is a legitimate methodological debate about making full exact invariance a universal gate. “Why Full, Partial, or Approximate Measurement Invariance Are Not a Prerequisite for Meaningful and Valid Group Comparisons” argues that meaningful comparisons can sometimes be justified without exact equality at every parameter. That argument is a reason to avoid treating an invariance label as a magic certificate or a single mandatory recipe. It does not supply missing results for the Lebanon–UK TEIQue data. A defensible analysis would still state the estimand, identify which parameters differ, and explain how the chosen comparison handles those differences. The practical conclusion is narrower: the 2021 paper provides exploratory evidence of resemblance, while an answer about directly comparable scores requires an analysis matched to the score question and its target population.
For example, evidence supporting comparable factor relationships would not, by itself, settle whether group means can be compared. Conversely, a partial model might support a carefully bounded estimate if the non-equal parameters are identified and the estimate remains interpretable under the stated assumptions. The point is to connect the model decision to the inference readers will make, rather than report “invariance” as if it were a single pass-or-fail property. Nothing in the Lebanon–UK paper reports this item-constraint sequence, so these are requirements for a future analysis, not a reinterpretation of its exploratory coefficients or t tests.
Sources: Measurement Invariance in the Social Sciences: Historical Development, Methodological Challenges, State of the Art, and Future Perspectives; Why Full, Partial, or Approximate Measurement Invariance Are Not a Prerequisite for Meaningful and Valid Group Comparisons
What do the reported country score differences mean?
The 2021 study reports differences on selected observed scores among its recruited respondents. In “The Trait Emotional Intelligence Questionnaire in Lebanon and the UK — UCL Discovery record,” the institutional summary notes higher Lebanese sample scores on Sociability and several facets, while the UK sample scored higher on stress management, optimism, and Relationships. The paper’s global TEIQue score difference was not statistically significant. These are results of the reported group tests on questionnaire scores; they describe how the two analyzed samples differed on those measures.
That description has a clear boundary in the recruitment. The researchers analyzed 342 Lebanese and 187 UK undergraduates recruited through university courses. A t test evaluates whether the observed group difference in such data is distinguishable from sampling variation under its assumptions. It does not turn course-recruited students into probability samples of Lebanon or the UK. The study therefore cannot establish that one national population has higher emotional intelligence, or estimate the size of a national difference. The direction of a sample result remains useful for describing these respondents; the sampling design limits how far it travels.
The nonsignificant global-score test has an equally specific meaning: this analysis did not detect a statistically significant difference in the global scores for these samples. It does not demonstrate that the national populations are equal, nor that the groups have identical global scores. Establishing equality would require a design and analysis capable of defining and estimating an equivalence range; a failure to reject a difference is not that test. The broad total can also conceal mixed facet directions, which is why the selected subscale findings should be reported as selected results rather than compressed into a country-level ranking.
A reader citing the study can say that the recruited Lebanese and UK undergraduates showed some observed score differences, while their global-score comparison was not statistically significant. A stronger claim about group means would need the direct measurement evidence discussed above, together with a target population that supports the intended inference. Even then, a measurement model would not repair an unrepresentative sampling frame: it addresses whether scores can be compared, while sampling determines whom the estimate describes. Keeping those questions distinct preserves what the t tests contribute—a record of these respondents’ scores—without turning them into a national portrait.
This distinction is useful when a paper or report uses the word “country.” Here it identifies where participants were recruited, not a demonstrated national-level cause of their scores. Differences could reflect the particular students reached, their educational settings, or other features of these samples; the reported tests do not isolate those explanations. That does not erase the comparisons. It makes their proper subject explicit: the observed scores of the participating undergraduates under the study’s recruitment and measurement conditions. Any broader interpretation needs new evidence about both the score scale and the population being described.
Sources: The Trait Emotional Intelligence Questionnaire in Lebanon and the UK — UCL Discovery record
What do later studies add—and what remains version-specific?
Later TEIQue research adds relevant evidence, but it answers three different questions. The five-culture paper, “Emotional Intelligence in Young Women from Five Cultures: A TEIQue-SF Invariance Study Using the Omnicultural Composite Approach Inside the IRT Framework,” examines the 30-item short form among women in Canada, China, Italy, Lebanon, and Spain. Its university-repository abstract describes an item-response-theory approach using an omnicultural composite. The abstract reports invariant results for Emotionality and Well-being, alongside facet-specific differences involving Self-control in the Chinese sample and Sociability in the Lebanese sample. This is the most directly cross-cultural of the later studies, and Lebanon is represented. But it is an abstract-level account: the full article was not accessed for this review, so the reported summary does not justify reconstructing its detailed model choices or extending its findings beyond the facets named. Its population and short-form instrument also differ from the English full-form comparison of university students in Lebanon and the UK.
A second stream studies what the short form predicts in a particular educational setting. “Positive Affect and Self-Care Mediate the Relationship Between Trait Emotional Intelligence and Academic Engagement in Lebanese Undergraduates” analyzes online academic engagement during COVID-era learning among 717 Lebanese undergraduates using the 30-item TEIQue-SF. The 2024 article uses structural equation modeling to examine links among trait emotional intelligence, positive affect, self-care, and engagement. Its reported model places positive affect and self-care in the relationship between trait emotional intelligence and academic engagement. That result makes the short form relevant to a specific criterion question in this sample and setting; it does not test whether Lebanese and UK scores share a scale. The authors also state that the short form had not yet been validated in Lebanon at the time of their study. That is a statement about the validation status they described in 2024, not a claim about what may have happened afterward, and not a validation judgment on the full English form examined in the earlier comparison. The paper reports an alpha of .88 for the short-form global score in its own sample; that internal-consistency result belongs to this dataset and is not itself evidence of cross-cultural equivalence. The engagement model’s outcome is academic participation in online learning, not a direct test of whether the TEIQue measures the same latent score across groups. A model can illuminate how measured variables relate in one setting while leaving item functioning and cross-group score interpretation untouched. The distinction is useful here because “validity evidence” can refer to more than one kind of question: prediction or association with an outcome does not substitute for a comparison of measurement across populations.
The later full-form article, “Investigating the Discriminant, Criterion, and Incremental Validity of the English Version of the TEIQue in Lebanon,” returns to the English full TEIQue, but asks about validity relationships within Lebanon rather than equivalence between Lebanon and the UK. It analyzes 305 Lebanese undergraduates aged 17–30 and reports associations with emotion-regulation strategies and selected outcomes, as well as regression analyses testing incremental prediction beyond Big Five factors. Among its reported findings, Self-control contributed to prediction of procrastination beyond those factors. The authors frame this work in terms of discriminant, criterion, and incremental validity: whether the measure relates to distinct constructs, to relevant outcomes, and adds predictive information beyond established personality factors. That makes the paper a useful addition to the Lebanese full-form evidence base. Its regression result concerns the specific criterion and statistical model studied, however; it cannot be converted into a claim about every TEIQue facet, a causal effect on procrastination, or the comparability of scores with UK respondents. These are correlational and regression results for the outcomes and students studied; they do not show that emotional intelligence caused those outcomes or that the full questionnaire functions identically across countries.
The provenance matters when weighing this addition. The article says its 305 students were drawn from the larger dataset used in the earlier Lebanese study. It therefore supplies a different analysis and validity question using an overlapping pool of Lebanese cases, rather than an independent replication of the Lebanon–UK comparison. Taken together, these studies extend the evidence in separate directions: the women-only short-form paper reports selected cross-cultural invariance findings; the 2024 Lebanese short-form paper models academic engagement and records its authors’ then-current validation statement; the later full-form paper tests selected within-Lebanon validity relationships. Their results are useful on those terms. None reports the same English full-form, Lebanon–UK comparison with the score-equivalence question needed to determine whether group means or score units can be directly compared.
Sources: Emotional Intelligence in Young Women from Five Cultures: A TEIQue-SF Invariance Study Using the Omnicultural Composite Approach Inside the IRT Framework; Positive Affect and Self-Care Mediate the Relationship Between Trait Emotional Intelligence and Academic Engagement in Lebanese Undergraduates; Investigating the Discriminant, Criterion, and Incremental Validity of the English Version of the TEIQue in Lebanon
How should you describe or use the finding?
A defensible citation would say: the English full-form TEIQue produced a similar broad four-factor pattern in the recruited Lebanese and UK university samples, with strong alignment to the intended factor map. That describes the structural result without turning it into a claim that national populations have equal or different emotional intelligence. If the comparison will support a consequential conclusion, first ask whether evidence addresses the exact language, questionnaire version, population, and score question at issue. A researcher or assessment provider can answer a useful follow-up: “Do you have item-level cross-group results for this same form, and do they support the particular comparison I want to make?” The answer should identify the estimate those results support, rather than relying on a general statement that the test is valid across cultures. For example, evidence for a shared factor pattern and evidence suitable for comparing average scores are different answers, so the provider should name which one the analysis actually addresses. In a discussion about a report or study, keep the requested inference explicit before moving from a broad structural result to any group comparison. For personal reflection on recent behavior and judgments about authored scenarios, the separate private 32-item Emotional Skills Profile is available at /assessment. It is a different product and offers no evidence about TEIQue equivalence or country comparisons.
Sources
- The Trait Emotional Intelligence Questionnaire in Lebanon and the UK: A comparison of the psychometric properties in each country — accepted manuscript
Primary source for the 2021 study’s design, participants, exploratory factor results, cross-loadings, factor alignment, internal consistencies, sample score tests, and stated interpretation.
- The Trait Emotional Intelligence Questionnaire in Lebanon and the UK — UCL Discovery record
Institutional record confirms publication details and summarizes the four-factor result, factor-score correlations of at least .90, Tucker congruence, and sample t-test findings.
- The Comparability of the Universalism Value over Time and Across Countries in the European Social Survey: Exact vs. Approximate Measurement Invariance
Methodological example of configural, metric, and scalar invariance and exact versus approximate approaches, applied to European Social Survey universalism values rather than TEIQue.
- Measurement Invariance in the Social Sciences: Historical Development, Methodological Challenges, State of the Art, and Future Perspectives
Review explains the purpose and limits of configural, metric, and scalar comparisons, including that configural resemblance alone supports no substantive group comparison and scalar evidence is relevant to latent-mean comparisons.
- Why Full, Partial, or Approximate Measurement Invariance Are Not a Prerequisite for Meaningful and Valid Group Comparisons
Presents a credible methodological counterargument to treating exact full measurement invariance as an absolute prerequisite for every meaningful group comparison; supports a more qualified account of what design, estimand, and evidence a comparison requires.
- Emotional Intelligence in Young Women from Five Cultures: A TEIQue-SF Invariance Study Using the Omnicultural Composite Approach Inside the IRT Framework
Abstract-level evidence for a 30-item TEIQue-SF study of women in Canada, China, Italy, Lebanon, and Spain using an item-response-theory omnicultural-composite approach; reports invariance for Emotionality and Well-being and facet-specific differences for Chinese Self-control and Lebanese Sociability.
- Positive Affect and Self-Care Mediate the Relationship Between Trait Emotional Intelligence and Academic Engagement in Lebanese Undergraduates
The 2024 study used the 30-item TEIQue-SF with 717 Lebanese undergraduates in an online COVID-era academic-engagement model; its authors state the short form had not yet been validated in Lebanon at that time and report alpha .88 for the global score in this sample.
- Investigating the Discriminant, Criterion, and Incremental Validity of the English Version of the TEIQue in Lebanon
The later study analyzes English full-form TEIQue validity relationships in 305 Lebanese undergraduates ages 17–30, reports associations and incremental prediction for selected outcomes beyond Big Five factors, and states its sample came from a larger dataset used in the earlier Lebanon study; it adds validity evidence, not an independent replication or cross-country invariance test.
Apply it to the real situation
Turn an EQ idea into a behavior you can reflect on
From this guide: The TEIQue comparison concerns group-level evidence; it does not describe your own recent emotional habits or choices in situations.
The Lebanon–UK study clarifies what one questionnaire comparison supports, but it cannot show how your own emotional habits appear in everyday situations. The private 32-item Emotional Skills Profile offers a structured way to reflect on recent behavior and scenario judgments, then identify a practical development priority. Use it as an educational reflection tool, not as a TEIQue equivalent or a country-comparison measure.